We continue our tradition of sharing with you our almost-annual keyword popularity reports. Previous reports can be viewed at the links: 2017, 2018, 2019 and 2021. Last year we also launched an interactive service where you can conduct research yourself and draw your own conclusions: https://keystat.imstocker.com/ (available for paid subscribers of our program to upload and submit files to microstock agencies ImStocker Studio). We cleaned it up a bit, updated it and filled it with the latest data. So, let"s begin!
First, about our database. Every time you make a request in our free keyword suggestion service, our database is growing and at the moment its size already exceeds 205 million works. Files in the database by microstocks and by types of work are distributed as follows:
General statistics
In this article, we will look at keyword rankings based on the following criteria:
- Frequency of word usage
- Growth in the number of new files in 2022
- Presence in TOP of 2022
- Total downloads
- Growth in the number of downloads in 2022
- Authors of new files in 2022
We will consider ratings for all types of files at once, but in our interactive web service you can view it separately for different types, for example, for all images or only for videos, or for some combination of types.

To build the report, 100,000 most frequently used words were selected, including both single words and phrases. Then the singular and plural forms for the same keyword were combined together. As a result, more than 90 thousand keywords were obtained.
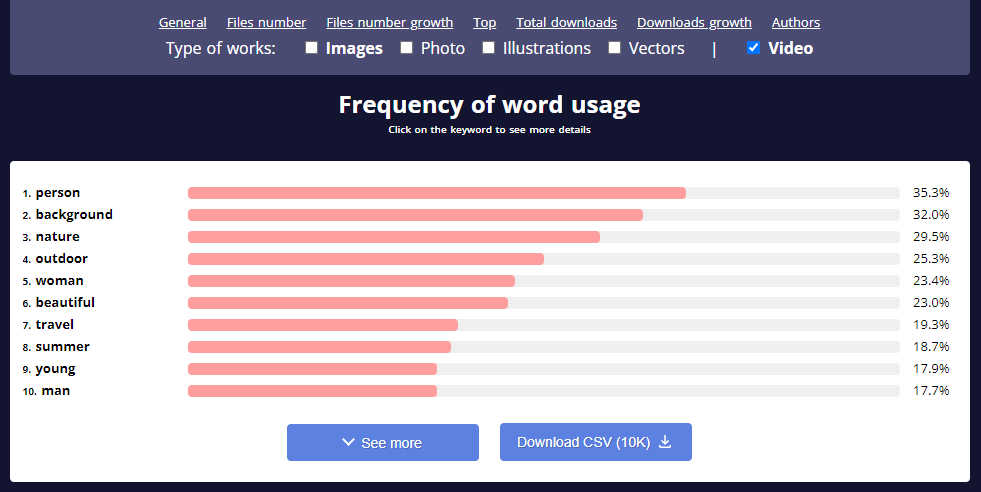
Frequency of word usage
This criterion shows how often a particular keyword is used. It is counted as the number of files containing a particular word, divided by the total number of files and multiplied by 100%. 100% will mean that all files contain a certain word, 50% that half of the files contain this word.
The undisputed leader here is the keyword “background” (44.5%) - it is used in almost every second work on microstocks. Not far from it comes the word “white” (27.1%), which is often used together with the word “background”, because a vast number of files are images of isolated objects on a white background. Next are the keywords of traditional topics: people, nature, travel, business, food, and so on. This metric does not change much from year to year and allows us to conclude which topics are mostly used in microstock files.
In our interactive web service, you can also see not only the first in the ranking, but you can also download the list of up to 10 thousand entries by rating in order to conduct your more detailed analysis. This also works in conjunction with a filter by type, for example, you can find out the most frequent topics by video.
Growth in the number of new files in 2022
The rating shows how much the number of new files with a particular keyword has grown compared to the growth over the past year. It is calculated by dividing the number of files that appeared in the current year by the number of files that appeared last year, multiplied by 100% and shifted so that 0% means that the growth rate is the same as it was, and 100% means that the growth rate doubled. For greater accuracy, one microstock agency (Shutterstock) is taken into account and only for keywords that were used at least 10 thousand times in the current year (2022), and at least 15 thousand times in total.
This metric reflects topics that are relevant in 2022, i.e. topics that, according to the authors on microstocks, should have brought the most income. Note that in order to understand whether they were actually popular with buyers, you need to analyze other metrics. In our interactive web service, you can click on a keyword and find out detailed information about it, see an example at the end of the article.
Presence in TOP of 2022
The ranking is based on the presence of the keyword in the Shutterstock’s TOP. TOP is the first 10 thousand files in the search results for an empty request. The most popular and promising works according to the Shutterstock search engine get into the top. The metric is calculated as the number of files during the year containing a particular keyword, divided by the total number of files in the top for the year and multiplied by 100%. Thus, 0% means that the word was not present in the TOP, 100% means that the word was present in all TOP files throughout the year
At the beginning, the list is very similar to the list of rating by frequency of use (since frequently used words will be both in TOP works and in others), but as you dive into it, the lists begin to differ more and more. Through our interactive web service, you can dig deeper and download up to 10,000 keywords sorted by top presence.
This metric is also interesting in terms of dynamics throughout the year. In interactive web service service, by clicking on a keyword, you can see its presence in the TOP by month. Moreover, you can compare the dynamics of this year with the past in order to understand whether the topic is relevant all year round, or it is seasonal, or it is a trend that is relevant only in the current year. An example is given in the last chapter of the article.
Total downloads
The rating is based on public download data, which is displayed on Dreamstime and CanStockPhoto microstocks. These are not the largest microstocks, so the indicator is interesting not in absolute terms, how many times files were downloaded, but in relative terms, how much more files with one keyword were downloaded than with another. The metric is calculated by dividing the number of downloads of all works containing a particular keyword by the total number of downloads of all works in the database. So the keyword would have 100% if it was present in every downloaded file, and 50% if it was present in half of the downloaded files.
This metric takes into account all years, so the most typical topics that are in demand on microstocks will be in the lead.
Growth in the number of downloads in 2022
Now consider the increase in the number of downloads per year. The metric is calculated by dividing the total number of downloads of all files containing a particular word at the end of 2022 by the total number of downloads at the end of 2021, multiplying by 100% and shifting so that 0% means that there is no increase, and 100 % meant that the increase was twofold. In other words, the metric shows how much percentage the number of downloads has increased over the year. To reduce noise, only keywords that are repeated at least 15 thousand times take part in this rating. In addition, in this rating only files for which there were data for the current and two previous years were taken into account (i.e., it is calculated for files that have been on microstock agency for at least 3 years).
Authors of new files in 2022
The latest rating is a new metric that should tell you more about the competition. If the frequency of usage metric shows how many files contain a particular word, then this metric shows how many authors use a particular word in their work. It is calculated by counting unique authors whose new works in 2022 contain certain words, dividing this value by the number of unique authors and multiplying by 100%. 100% would mean that each author uses a certain word in their work, 50% that half of the authors use a certain word.
The metric is rather interesting when analyzing specific keywords, which can be done through our interactive web service. An example is given in the next chapter.
Diving Deeper - Analysis of Individual Keywords
As we have repeatedly mentioned 😀 in our interactive web service, you can see not only a list of keywords sorted by one or another criterion, but also see detailed information about the keyword. To do this, you can either click on keyword in any of the lists, or use the search bar
Consider a simple and clear example - the keyword "christmas". This topic has always been in demand on microstocks, although it has a clear seasonal character. Let"s find out more about her.
So, the first block of information about a word is its place in the ranking.
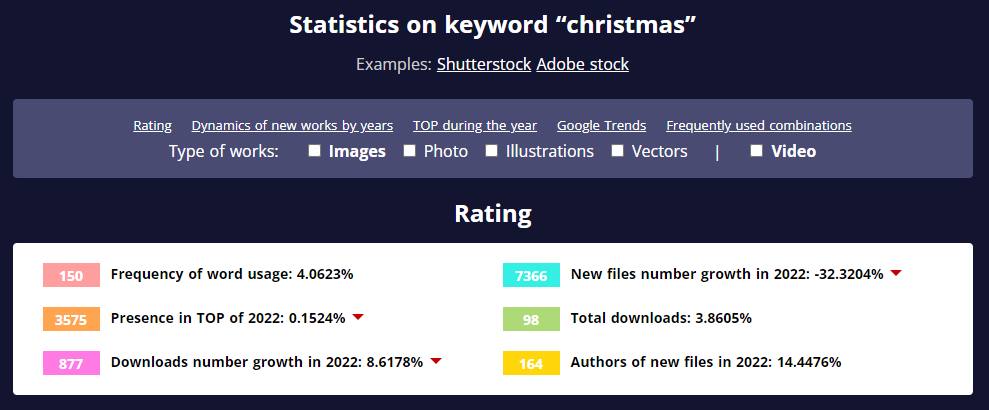
According to the “Frequency of words usage” indicator, we can conclude that this word is used very often (every 25th file contains it). It is used by every 7th author on microstocks (see the indicator “Authors of new files in 2022”), which confirms the high competition.
According to the “New files number growth in 2022” indicator, it can be concluded that the authors’ interest in this topic is declining. Below is a graph of the dynamics of the number of new works confirms this trend.
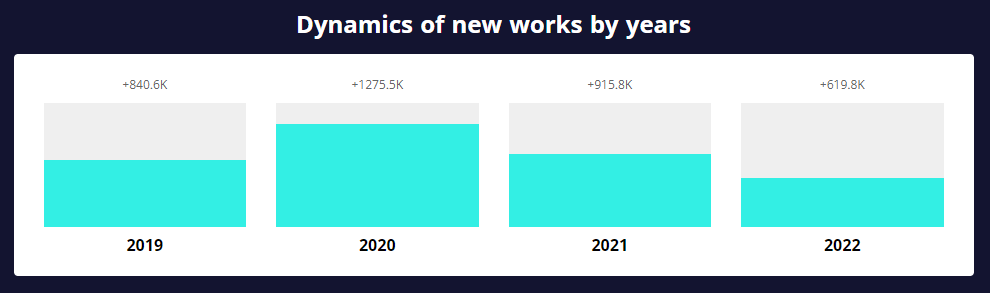
In the picture, the numbers above the columns are the growth in the number of files in our database. On the microstock itself (Shutterstock), the increase, of course, is greater in absolute terms, but the trend is the same (we checked by comparing the number of files in the search results for the keyword in different years. We checked several keywords in the same way). It shows that the growth rate has been falling for the second year, although the increase is still quite big compared to other keywords
A good position in the rankings for “Total downloads” indicates that this topic is regularly in demand on microstocks, although you need to be aware of strong competition.
The indicator “Downloads number growth in 2022.” interesting compared to the previous year. To do this, you can hover the mouse over the rating value, and the data for the previous year will be displayed in a tooltip.
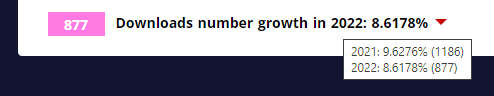
In this case, although there is a decrease, it is not very obvious. Given this error, we can say that the interest of buyers is stable.
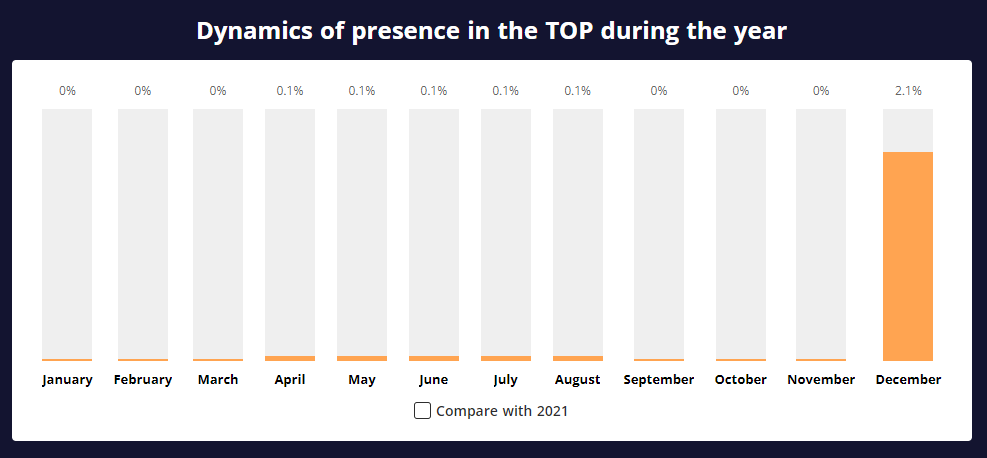
The low value of the “Presence in the TOP’s for 2022” indicator related to seasonality. If we look at the distribution by months (chart below), then this topic was in the TOP only in the last month of the past year
By checking the “Compare with 2021” checkbox, you can make sure that the peak in December was also last year, which means that this topic is really seasonal and is repeated from year to year.
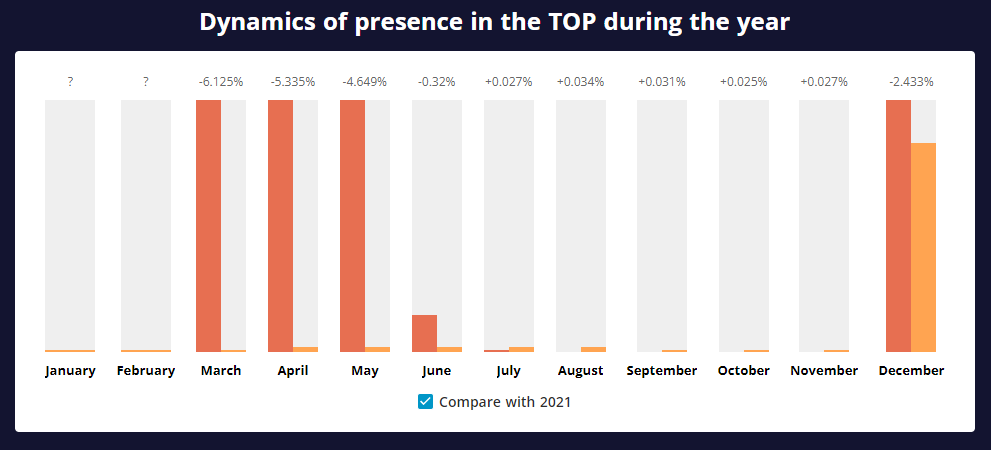
In comparison, it is also noteworthy that in 2021 there were high values in the first half of the year (ignoring the first two months - there is simply no data for them). This likely indicates a change in Shutterstock"s ranking algorithms.
Under the graphs of TOP"s dynamics on the page, a graph of trends of the Google search engine is also displayed.
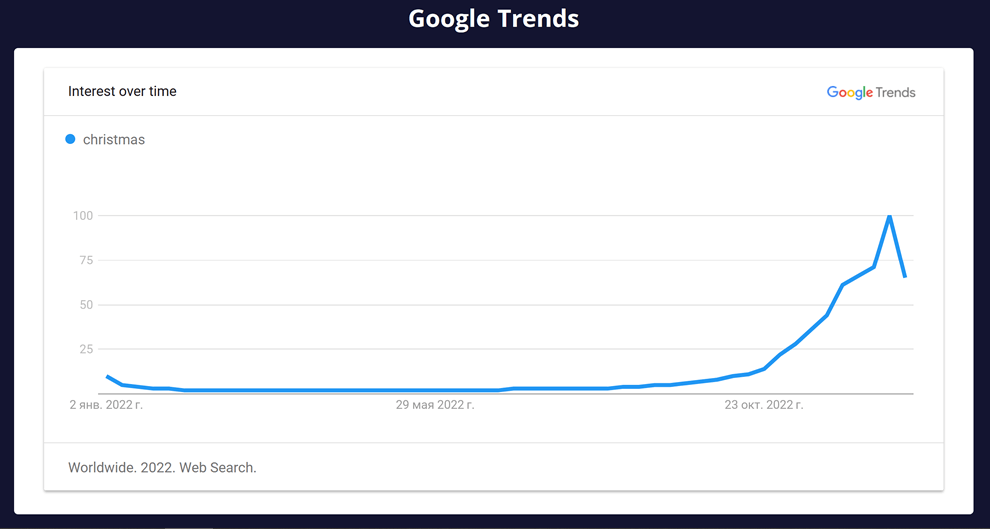
Google Trends will allow you to find out if there is any external reason for the growth of TOP in a particular month or not.
And the last block on this page is a set of related keywords that were used most often in 2022 in conjunction with the current word.
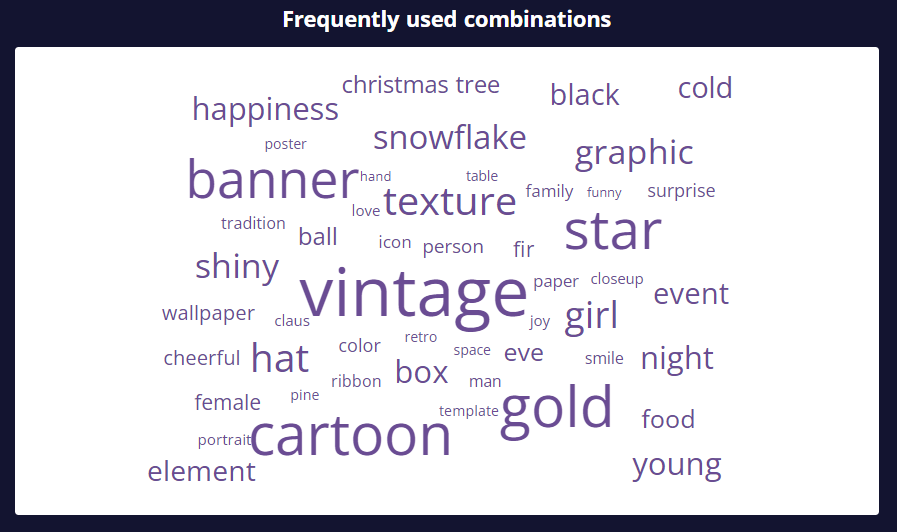
This block will help you better understand the context of the use of the keyword. In addition, this cloud is interactive, it can be a great starting point for your research - you can click on any of the words and continue exploring the topic that interests you.
That"s all for now, dear users. We really hope that our review and interactive web service will help you plan your next shoot or choose a topic for your next illustration. We launched a survey in our telegram group and if you want to receive more such information, we ask you to participate in it
Dream, create and bring to life. And ImStocker, in turn, will do everything possible to help you achieve success!
Your faithful assistant, ImStocker
P.S. Do not forget to subscribe to us on social networks (https://t.me/imstocker_en - here we publish our news, https://t.me/imstocker_chat_en - and here you can ask a question or chat, https://twitter.com/imstocker - twitter page) to be the first to know about the latest updates!