In 2017, 2018 and 2019 we have already shared similar data, and this year we are renewing the tradition. Since then, our base has grown fivefold and now it consists of more than 150 million works. By microstock and by type of work, it is distributed as follows:
In our report, just like last time, we focus on two types of files: all images (photos, illustrations and vectors) and video files. However, in addition to the report itself, we will also share a tool that you can use to view data separately for each file type, as well as for any of their combinations. We will talk more about this tool at the end of today's article.
To construct the report, 100 thousand of the most frequently used words were selected, including both single words and phrases. The metrics for the singular and plural forms of the same keyword were then combined together. As a result, more than 90 thousand keywords were obtained.
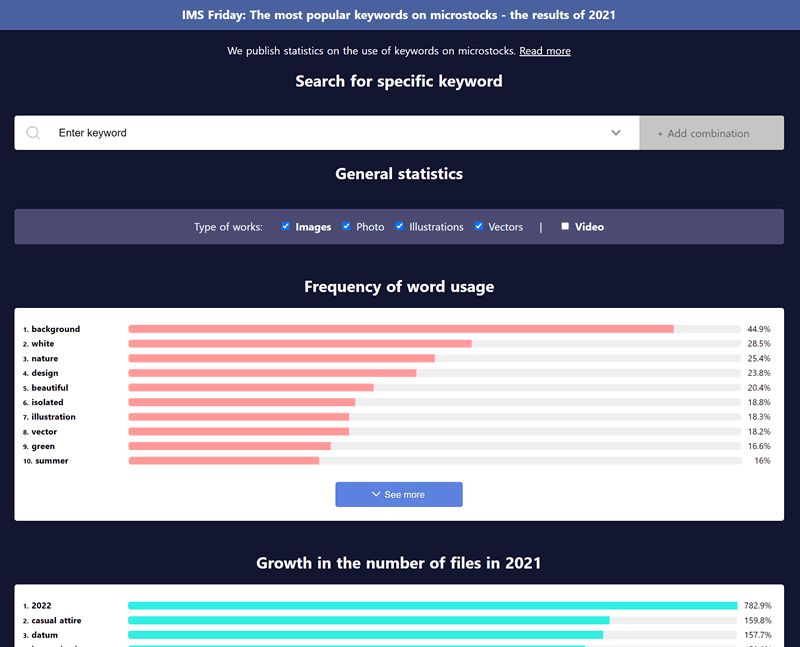
Frequency of word usage
Let's start with the simplest metrics, let's see how often this or that word is used. The percentage in this metric means how many files of a given type contain a given word.
From year to year, the leaders in this list are repeated; with the growth of the base size, they only secure their positions.
The absolute leader is the word “background” - it is found in almost half of the images and in a third of the videos. In images, it is often used in combination with the word "white", because many files contain various objects on a white background. The word “isolated” is also applicable to the same files - another leader (6th place, 18.8%). This is less typical for videos, the word "isolated" takes 71st place in them (6.6%)
A third of all images in the database are illustrations and vectors, hence the popularity of words such as “design”, “illustration” and “vector”.
About a tenth of the files contain the keyword "closeup" - images and videos of close-up objects.
The main topics are people, travel, food, business, nature, technology. Despite current and recent events, the medical topic is not presented here. Files from the entire observation history are included in this rating. This is a very stable metric, it can be used to track “eternal” themes that are used in works from year to year.
Growth in the number of files in 2021
Let's now look at the frequency of the use of words in dynamics, namely, we will identify the keywords that showed the largest growth in the number of works in 2021. This metric shows the percentage of the increase in the number of files with a particular keyword during this year: 0% will mean that the number of works remained the same, 100% - doubled. In order to filter out the noise, only keywords that were used last year at least 5 thousand times and at least 10 thousand times this year were considered.
The word “2022” became the leader among images, showing almost 9-fold growth. Traditionally, authors prepare files dedicated to the next year in advance, especially on the eve of Christmas and New Year.
Interestingly, the keywords “lineart”, “linear”, “contour”, which describe footage depicting contour objects, turned out to be the leaders among the videos.
Other topics showing great growth are vaccinations, casual wear, video calls, cryptocurrencies, new normal, and others.
Presence in TOP of 2021
The previous two metrics showed the topics with which authors upload works to microstock. Now let's see what topics buyers are interested in. The next metric is the presence of the keyword in the TOP of Shutterstock, one of the largest microstock agencies. TOP consists of 10 thousand files returned by an empty request. These are files that are most likely to be at the forefront of search results, and it can be assumed that the files most demanded by buyers fall into it.
This metric shows in what percentage of the entire TOP a particular keyword was present during the whole year (or rather, the last 10 months. The first two months, unfortunately, were dropped for technical reasons).
The first place is occupied by the keyword "background". This is not surprising given how many files contain it.
At the top of the rankings for many topics, there is an overlap with the topics of the word frequency metric. These are the very “eternal” themes that are always in demand. However, just below the list, keywords appear that reflect the current reality: “coronavirus”, “virus”, “medical”, “covid-19”, “pandemic”. Every tenth work in TOP is devoted to these topics.
Total downloads
The way TOP is formed is not known for certain, therefore it can only indirectly indicate consumer demand for certain works. Fortunately, there are microstocks that publicly display the number of downloads. These microstocks include CanStockPhoto and Dreamstime. These are not the largest microstocks, however, based on their results, with a certain degree of skepticism (and optimism), one can judge the demand for certain topics on the market as a whole.
To calculate this indicator for each keyword, the number of downloads of all works in which it is present is summed up. After that, the result of the best keyword is taken as 100%. For example, if the value of another keyword is equal to 50%, it will mean that the files with it were downloaded two times less than the files with the best keyword of this metric.
In the front rows, all the same “eternal” themes are visible. Hence, we can conclude that, at least, this metric is not hopeless. However, neither the TOP presence, nor this metric takes into account competitiveness, and this is very important in finding unoccupied niches.
Downloads per file
To form the next rating, we divide the number of downloads of files with a particular keyword by the total number of files with it. Thus, we will get the specific number of downloads per file. Let's take the result of the best keyword as 100%. When calculating this metric, keywords that were repeated less than 50 thousand times were eliminated to reduce the noise.
Growth in the number of downloads in 2021
Previous metric, much like the first one, was built on the basis of data for the entire time. Let’s now consider the growth in downloads in 2021. This metric shows how many times the total number of downloads increased during the year compared to the total number of downloads at the end of 2020. So, 100% will mean that the number of downloads has doubled.
The keyword “2021” became the leader for images, which indicates that works with a keyword containing the number of the current year are bought not only on the eve of the new year, but also during it.
The second place was taken by the keyword “continuous line”. This is a technique for drawing images with one line without breaking.
Another popular technique is "marbling" - the creation of illustrations similar to the natural patterns of marble and other stones.
Popular themes among images are “covid 19”, “new normal”, “self isolation”, “wild plant”, “remote work”, “lgbtq”, “zero waste” and others.
There are no obvious leaders among the videos. Only “covid” and “overlay” stand out the most.
Try it yourself
It is impossible to consider all aspects of the collected statistics in one article. Instead of boring you with a series of articles, we have prepared this tool for you. You can use it to do your own research.
With this tool, you can see not only the first 50 positions of each of the lists that are presented in the article, but also dive deeper into them. In addition, using the filter, you can select the type of work you are interested in or even a combination of them.

After selection, all lists will be rebuilt according to the marked types. The only limitation is that statistics on TOP, unfortunately, are not divided into separate types of images (photo, illustration, vector).
In addition to the above, the tool allows you to view detailed statistics for each of the keywords in the database (and there are more than 90 thousand of them). It includes:
- an indication of the place in each of the ratings;
- statistics on the number of new works by year;
- the dynamics of using TOP in the works by months;
- Google Trends search graph.
In order to view the statistics, either click on the keyword you are interested in in any of the lists, or enter it in the search box and press “Enter”. You will see the following page:
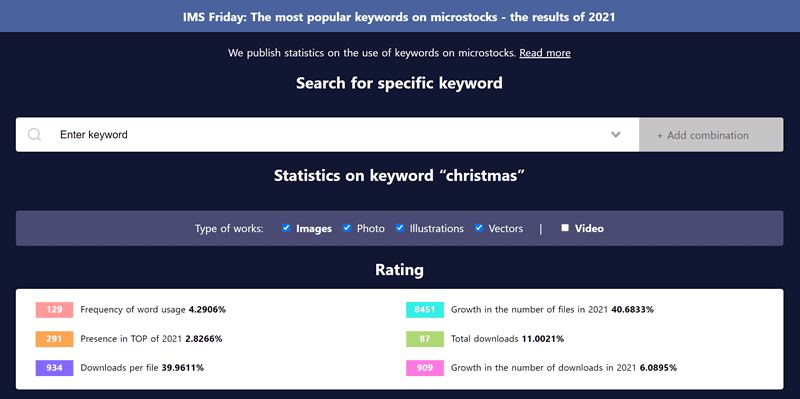
Specifying a place in each of the ratings will allow you to better understand the prospects of a particular topic in the context of several metrics at the same time.
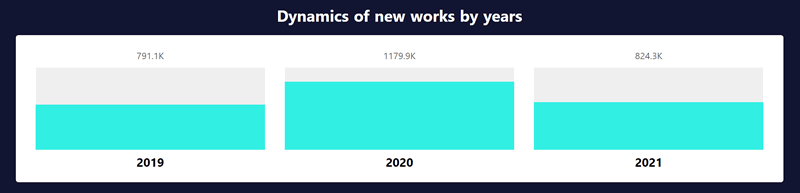
Statistics on the number of new works by year shows how many new files have appeared in the database in 2019, in 2020 and in 2021. This will allow you to assess whether a given keyword is regularly used, whether there is a tendency to increase or decrease in its usage.
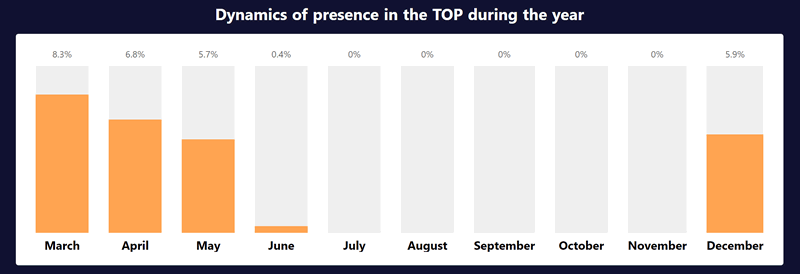
The dynamics of usage in TOP's works by month will allow you to assess whether this keyword is seasonal, as well as to associate the surge in its usage with some event.
And the last block is the Google Trends widget. It should complement the picture of the previous block with a global trend.
In addition to all this, if the tool turns out to be in demand, we plan to add more statistics on the use of a combination of two words together.
The tool is located at: https://keystat.imstocker.com. It is available for free for all active ImStocker Studio PRO subscribers
We hope that this information was useful to you and will help you in your search for new relevant niches. We wish you success!