Hello, Dear user of the ImStocker service!
As part of the development of our services - IMS Keyworder and IMS Studio - we have accumulated various interesting statistics on stocks, which we are willing to share with you in our “mini-magazine” ImStocker Friday. ImStocker Friday will contain only unique and up-to-date information about stocks. Keep an eye out for the new issues in our Instagram - (feel free to subscribe as well)
Today we present to you a statistical analysis of the authors profiles on one of the largest microstocks - Shutterstock. Who are these people? Do you want to know where they live and create? What kind of works and how much are they submitting? What is the scale of the competition today?
So, according to the investor report on Shutterstock, there are over 1.7 million registered contributors to date, who have posted over 370 million images and over 21 million videos. We have collected public information from the profile pages of approximately 645,000 authors, including photographers, illustrators and videographers. This is 38% of all users, but the accumulated number of their submissions is 95% of the total number of submissions in the stock. It is already astounding that the remaining million authors have an average of only 20 submissions in their portfolio.
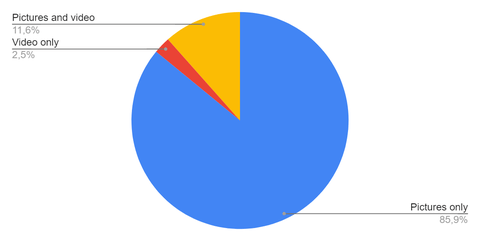
So, how are authors distributed by type of work? 85.9% of authors upload only images (unfortunately, we do not yet have a breakdown of how many of them upload photos, and how many illustrations and vectors), 2.5% upload only videos, and 11.6% of users upload both. We'll come back to this matter in a future issues to look at the dynamics, but according to the same report for Shutterstock investors, the annual growth rate of the stock video market is higher than the growth rate of the stock image market (5.9% versus 4.8%). It can be predicted that the share of videographers will increase in the future.
Where do microstokers live? Of course, we do not follow them, and we can only judge by which country the authors indicated on their profile page. In total, 59% of users in our sample did this. Here's the distribution we got:
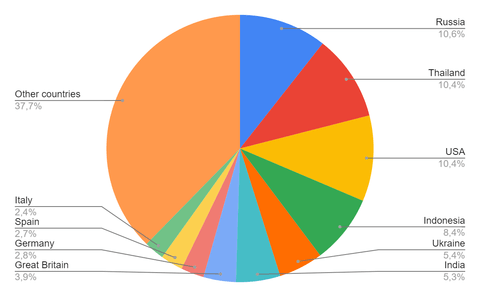
Among the countries the leaders are: Russia, Thailand and the USA. They have an approximately equal share of the number of authors ~ 10%. Followed by Indonesia (8.4%), Ukraine (5.4%) and India (5.3%). In general, Shutterstock has representatives from almost every country in the world.
Let’s examine the distribution of authors by the number of published works. To do this, we divide them into 4 groups:
- I - from 0 to 100 submissions
- II - from 101 to 1000 submissions
- III - from 1001 to 10000 submissions
- IV - over 10,000 submissions
If we examine the images, then the distribution by the number of authors is as follows:
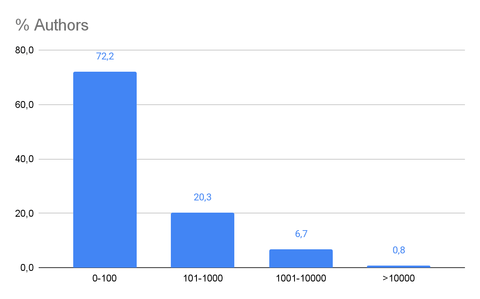
As you can see in the diagram, 72% of authors (about 450 thousand people) have no more than 100 images in their portfolio. I.e. only about 180 thousand authors are working more or less active and upload files.
Let's examine the contributions of each of the groups of authors to the overall Shutterstock base:

From this diagram, we can conclude that although representatives of group I (with the number of submissions from 0 to 100) are the most numerous, they make only a small contribution to the total number of images on the microstock. Almost half of the stock images belong to large portfolios with over 10,000 works.
And how are the groups of authors distributed according to the TOP of Shutterstock? I.e. whose images are most common among the first 10 thousand in the search results for an empty query?
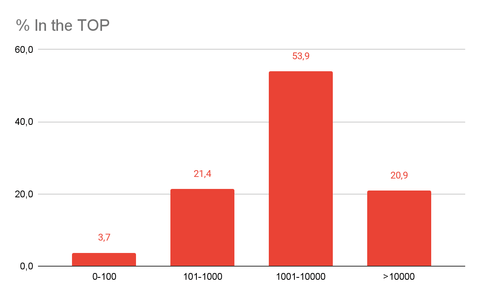
So, in total ~ 2 thousand authors are represented in the TOP. As could be expected, the least of all (3.7%) in the TOP were representatives of group I (0-100 images). It is interesting that the first place was taken not by the mastodons with the number of works over 10,000 images, but by the “happy medium” with the number of submissions from 1001 to 10,000.
Now let's look at the distribution of authors by the number of videos. The authors will also be divided into the same 4 groups:

As with images, the vast majority of creators have no more than 100 videos in their portfolio. More than 100 videos by about 16% of authors (this is about 15 thousand people).
Now let's look at the contribution of groups to the overall video base:
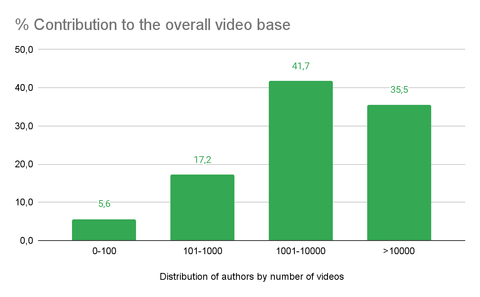
The vast majority of videos (77.2%) belong to portfolios with over 1000 videos.
Now let's look at the distribution by TOP among videos. Only about 2 thousand authors are represented here.

In the TOP, most of all authors are represented with the number of videos from 101 to 10,000. The difference from the distribution by images is most likely due to the fact that the number of videos on the stock itself is much less than the number of images.
So far we have everything. In the second part of the article, we will look at how microstockers are distributed according to the number of contributions, what is the typical percentage of rejections, what technique the authors prefer and in what styles they shoot their works. Subscribe to us on social networks!
Good luck to you!